The consequences of the Brexit referendum result will be far reaching. Despite the “Leave” side winning the referendum, Article 50 has yet to be triggered. Whoever is the next Prime Minister of the United Kingdom will be faced with this decision. Do they go with the democratic mandate given to them by the people, or do they instead call for a general election or second referendum, where the terms of the UK’s exit become the focal point of debate? Regardless of which course of action is undertaken by the UK’s politicians, it is imperative to know why the majority of people in the UK decided to leave.
Whilst imperfect, demographics provide us with strong clues as to why people voted the way they did. Without access to rich individual-level information, we must make do with using aggregated registration district data. For example, in a recent blog post, an academic has interestingly linked obesity to the propensity to vote leave! Another much discussed facet of the EU referendum has been the generational divide separating young and old. Scatterplots appear to show that education and social class are also important, although they are not analysed in a multivariate framework. Another excellent piece of analysis looked at voter turnout and weather conditions and found no effect of weather on the turnout.
Aggregated analysis might be problematic in the sense that we are using aggregated data to make inferences about individuals. For example, in the United States we know that the wealthier states such as California vote Democrat, even though wealthier individuals, on average, tend to vote Republican. This is known as ecological fallacy.
Thankfully, ecological fallacy is a well-known issue and political scientists have developed a battery of statistical techniques that allow the researcher to make inferences about individuals based on aggregated information. What I am intending to do is to use aggregated information to try and estimate the relative importance of age and education as determinants of voting behaviour.
The majority of the post-Brexit analysis has thus far focussed on the determinants individually. However, in this analysis I focus on these collectively. We know that both youth and educational attainment are positively associated with remain voters. Nevertheless, younger people tend to have higher qualifications than their older peers, so the age-vote leave relationship might be spurious.
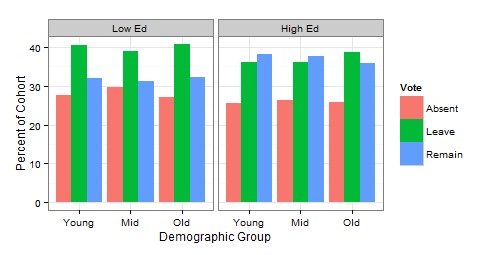
With this in mind I turn to the data. The election data I use comes from Thiemo Fetzer’s blog post on the effect of weather on voter turnout. I then linked these data to aggregated census data available from Nomisweb. Bear in mind that there is a five-year lag between these data points, but I would argue that the census data still provides a strong approximation of each area’s demographic profile. In other words, if a voting district had an elderly population in 2011, it is likely to have an elderly population in 2016. The Nomisweb site contains data on the age and qualification breakdown for each voting district. In this analysis I stratify these data into six distinct groups: young (aged 16-34 in 2011) and highly educated (A-level qualification and above), middle aged (35-49) and highly educated, old (50+) and highly educated, and these three age cohorts but without A-level equivalent qualifications or above (i.e. GCSEs only). Unfortunately, I was only able to obtain these data for England and Wales so Scotland and Northern Ireland are omitted.
I then analysed the breakdown of these data and estimated the distribution of voters by the aforementioned cohorts discussed in the above. The results of this analysis are shown in the figure below. In this plot I have separated these data into six age-education groups and within each group looked at the share of remain, leave, and absentee voters. The most striking finding in the below figure is the influence of education on voting. Low-education groups are far more likely to vote leave compared to their more educated counterparts. Additionally, age only appears to be a minor factor within the low-education cohort. The leave-remain vote is more evenly poised with the high education group. Also, we can see that there appears to be an age gradient here as age is positively associated with the leave vote share and vice versa with remain. However, the difference between these age groups is minimal. It appears that the age-vote leave relationship is confounded by education.