A Word from our Experts: How Did Donald Trump Win the 2016 Election?!
Following Donald Trump's election as US President, Dr Christopher Raymond looks at the voting patterns across the country and provides an analysis as to how Trump staged one of the greatest election upsets in American history.


Many were stunned to see Donald Trump edge out Hillary Clinton to win the 2016 presidential election. Though Clinton narrowly edged out Trump in the nationwide popular vote, Trump won the vote in enough states to secure a clear victory in the Electoral College. At the end of one of the most bitter, partisan political campaigns (certainly in living memory), Americans largely ended up voting along the same social and partisan lines that have divided them for decades. That being said, Trump’s victory was due to the beginnings of what may be a partisan realignment echoing the outcome of the Brexit referendum.
A Tale of Two Surprisingly Loyal Parties
Despite featuring the two most unpopular major-party presidential candidates since at least the advent of modern polling, the two major parties managed to appeal successfully to voters’ party loyalties. Based on the exit polls, 89% of self-identifying Democrats voted for Clinton, while 90% of Republicans voted for Trump. Among self-identified Independents (most of whom likely lean towards either the Democrats or Republicans), 48% broke for Trump while only 42% backed Clinton. Unsurprisingly in hindsight, though not at points earlier this year, this most partisan of elections ended up with Americans divided along…party lines.
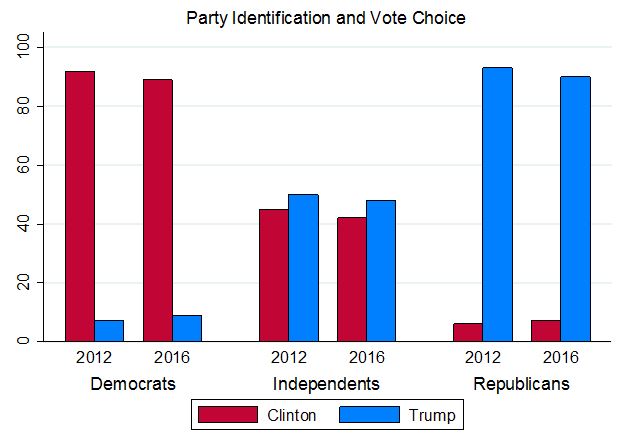
Particularly interesting was the fact that many late deciders broke for Trump. Of those who decided in the last month of the campaign, 49% voted for Trump, compared to 42% for Clinton (with the remainder supporting other candidates). While many Democrats feared the FBI director’s letter to Congress may have impacted the outcome of the race in Trump’s favour, it is doubtful this swayed many erstwhile Clinton supporters to switch to Trump. Instead, if it did impact the election, it only motivated Republicans to back their party’s nominee to the degree they did.
While Gary Johnson and Jill Stein managed to secure 3% and 1% of the national vote for their respective parties (Libertarian and Green), this election reaffirmed the centrality of party identification for understanding elections. Even when presented with two highly unpopular major-party candidates, most Americans found enough in the other major party’s candidate that was sufficiently objectionable for them to overlook any potential deficiencies in their own candidate. This certainly helped Trump limit Republican defection to Johnson – in turn, securing enough votes to edge out Clinton in close contests like Florida and North Caroline. Because the majority of Americans identify with one of the two major political parties, this election reaffirmed the centrality of party identification for understanding the US strict two-party system.
Divides Along Gender, Race, and Marital Status
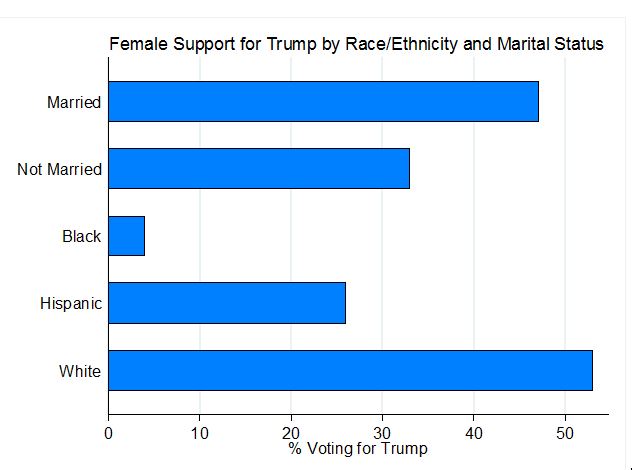
Though one might have expected wide support for Clinton given Trump’s past statements and actions towards women (as well as the opportunity to elect the first female president!), the gender gap was not sufficient to propel her to victory. For instance, while exit polls show Clinton won the female vote overall, the impact of gender on voting differed considerably by race/ethnicity and marital status. For instance, while unmarried women voted overwhelmingly for Clinton (62% to Trump’s 33%), married women were more evenly divided between Clinton and Trump (49% to Trump’s 47%). Moreover, while white women sided with Trump, black and Hispanic women voted overwhelmingly for Clinton. Thus, despite Clinton’s opportunity to break the ultimate glass ceiling, some women were too divided along party, rather than gender, lines to care.
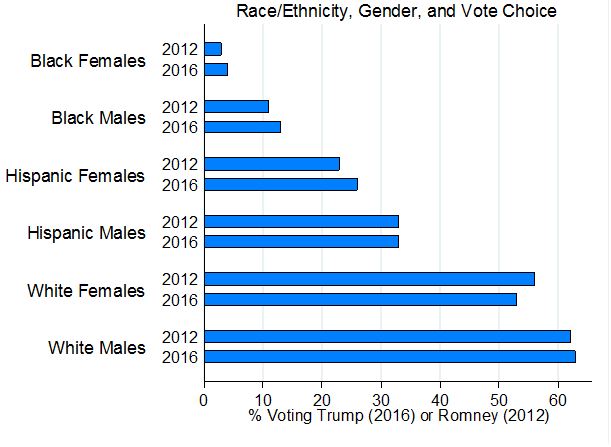
Unsurprisingly given his messaging throughout the campaign, Trump’s support among black and Hispanic voters was low – though, surprisingly, somewhat higher than in 2012. While white males constitute a shrinking share of the electorate (34% in 2016, compared to 39% in 2000), Trump’s support was rooted largely in a white male vote. Though Trump’s support was somewhat lower among white females, positing evidence of a modest gender gap, the combined vote shares of white male and female voters (70% of the total electorate) was sufficient to propel Trump to victory, especially in enough states like Wisconsin – where the white vote remains sizeable.
A Brexit-Like Realignment?
Though the national polls were largely accurate, overestimating Clinton’s popular-vote win only slightly, the polls in states with large bases of working class voters missed the mark. This was due to a small but important shift in the voter coalitions supporting the two major parties. Similar to that group of voters who propelled the Leave side to victory in the EU referendum, Trump’s vote reflected increased support among working class voters with less formal education – a point that was missed in several state-level polls predicting victory for Clinton.
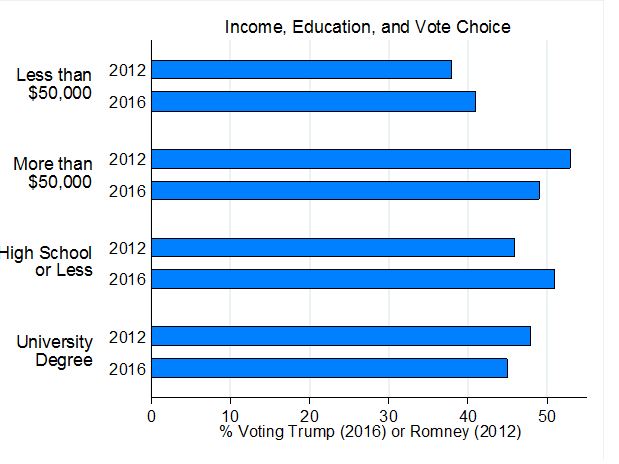
Although those earning below-median incomes remained more likely to support Clinton than Trump, the percentage of below-median income voters supporting Trump in 2016 was higher than the percentage supporting Romney in 2012 (and vice versa with those with higher incomes). Moreover, while support for Trump dropped among those with a university degree in comparison with 2012 (45% versus 48% in 2012), support for the Republicans increased among those with a high school education or less (51% in 2016 versus 46% in 2012).
Though admittedly modest, these shifts in vote preferences tipped the balance in favour of Trump in traditionally working class states like Pennsylvania, Wisconsin, and Michigan. As with Brexit and the underestimation of the size of the working class vote, most polls in these working-class states underestimated support for Trump, leading to the surprise results showing Trump victories in traditionally Democratic strongholds.
In Conclusion…
Though election 2016 is now over, the countdown to 6 November 2018 (the date of the next congressional elections) is already underway. Just as Americans begin to put this election behind them and look forward to a Trump presidency, they are facing an immediate future that will remain deeply partisan and bitterly divided.
In this era of Trump, party identification will continue to underpin these deep divisions, though the beginnings of a realignment along differences in class and education – similar to Brexit – seem to be underway.
The featured image in this article has been used thanks to a Creative Commons licence.
2 Comments
until almost the day of the election The ‘experts’ at princeton argued that the probability of a clinton win was between 98-99%. i don’t think there is a lot of respect out there at the moment for ‘experts’.
I want to send you an award for most helpful innetret writer.