Living Standards North and South in Ireland
In a special long-read article, Dr Graham Gudgin follows up on his recent article comparing living standards in Northern Ireland and Ireland.


Brexit has led to renewed calls for a border poll on Irish unity and within this context a number of studies have examined how living standards compare across the Irish border. Fitzgerald and Morgenroth (2019) concluded that living standards were higher in Northern Ireland. Two versions of a paper by Bergin and McGuinness (2020 and 2021) contested this and reported that standards were higher in the Republic of Ireland. In an article for this website on this subject, I wrote in February of this year that a rigorous comparison would show Northern Ireland ahead and briefly dismissed the conclusions of Bergin and McGuiness. In March Professor John Doyle replied. Rather unusually he replied as editor of the Journal ‘Irish Studies in International Affairs’ in which the latest of the Bergin and McGuinness articles had appeared. He particularly objected to the comment that Bergin and McGuinness used ‘discredited Irish Accounts’ to make their case that living standards are higher in the Republic of Ireland than in Northern Ireland’. Doyle went on to say that ‘It would be extraordinary indeed if both journals [ISIA and CJE] were so poor in their peer-reviewing as to allow work to be published that relied on discredited accounts.’
Professor Doyle obviously has more faith in journal reviewers than I do, especially in expecting reviewers for an English journal to understand the problems with Irish national economic accounts. In any event, let’s examine the evidence. The full reference to Bergin and McGuiness in my February article was as follows:
“Other authors [also] attempt to contest Northern Ireland’s advantage in living standards. Adele Bergin and Seamus McGuinness try this using the discredited Irish National Accounts, ignoring Honohan’s warnings about the data. They also use household incomes but again fail to adjust properly for price differences”.
The reference to Honohan was to a recent article by Patrick Honohan, who was Governor of the Irish Central Bank from 2099-15 and is currently a Senior Fellow at the Petersen Institute for international Economics. Dr. Honohan wrote an article in March 2021 titled ‘Is Ireland really the most prosperous country in Europe?’ in the Irish Central Bank’s journal ‘Economic letters’. This article made the same case as others, including myself, had earlier made that Irish measures of GDP are hopelessly distorted and provide a poor guide to either the size of the Irish economy or the living standards of its citizens. Others who had pointed this out included Paul Krugman who first adopted the term ‘leprechaun economics’ and also Brad W. Setzer who thought that Irish national accounts said more about the tax affairs of US companies than about the Irish economy.
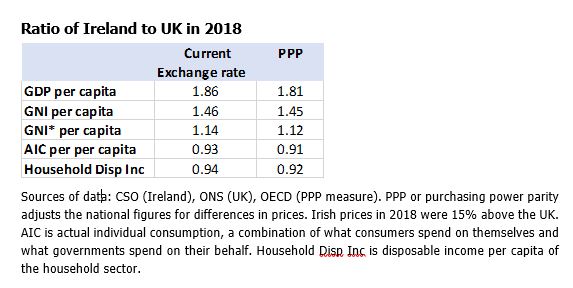
The table below compares the Irish and UK economies using official data from the CSO in Ireland and the ONS in Britain. The table shows the ratio of the Republic of Ireland to the UK for a range of indicators measuring the size of the two economies on a per capita basis. For instance, the top row shows that per capita GDP is 81-86% higher in the Republic than in UK. The first column shows the measures using the average exchange rate for 2018. The second column uses purchasing power parities- a measure of relative prices.
The table indicates, for instance, that per capita GDP in the Republic is almost twice as rich as the UK. This is of course a fiction since the Irish data is hugely inflated by the profits of global companies which route their profits through Ireland to take advantage of the low and sometimes minimal profits taxes in Ireland. GDP is often used by the UN, OECD, IMF and other international organisations as a standardising measure to make comparisons between countries on such things as spending on education, health or the environment. Because Irish GDP data is hugely inflated, Ireland is typically an outlier in such comparisons which fail to measure the true comparative position of Ireland.
The traditional way of adjusting GDP to record who owns the income rather than where it is produced is to remove what are called net factor incomes from abroad. This involves subtracting the profits of foreign corporations and wages of foreign workers earned in Ireland and adding in the profits and wages of Irish companies and workers earned abroad. If EU subsidies and taxes are also subtracted, the result is Gross National Income (GNI) which measures the incomes accruing to Irish companies and workers where-ever these are earned. In 2018 the CSO in Ireland calculated that net factor incomes to be subtracted from headline GDP amounted to a huge 70.6 billion euros, or just under 15,000 euros per head of population. By 2019 this figure had risen to 17,000 per head. As a result, Irish GNI was 23% smaller than GDP whereas in most advanced economies the two would be similar in magnitude. For OECD countries, the GDP and GNI differ by less than 2%.
Even this adjustment greatly exaggerated the true size of the Irish economy and the CSO was led to make a further adjustment unknown any where else in the world. Following a massively distortionary and wholly implausible 35% increase in Irish GDP in 2015 the CSO introduced a measure termed GNI* (Gross National Income star). This measure subtracted the profits of ‘redomiciled companies, i.e. firms which moved their headquarters to Ireland without any real activity in Ireland. This removed a further 5 billion euros from the national accounts. A much larger reduction of 54 billion euros (11,000 euros per head) was made to remove the depreciation on foreign-owned intellectual property and aircraft leasing. Multinational companies had registered much of the value of their brands and intellectual property in Ireland again for tax reasons reflecting Ireland’s very low corporation tax rate of 12.5% and its lenient taxation of intellectual property. These registered assets are capital and do not count as GDP or GNI, but international rules determine that the depreciation of these assets does count. It was for instance that the decision of the global aircraft leasing industry to register its assets in Ireland led to the huge increase in GDP in 2015. There is no equivalent of GNI* in the UK (or in most other countries) since there is no need for such an adjustment except in tax havens.
There can be no doubt that GDP or GNI are discredited as measures of living standards. The use of GNI as a benchmark for some EU payments means that mismeasurement will involve a real fiscal cost for Ireland for instance in payments to the EU. Some regard GNI* as a reasonable measure of the size of the Irish economy, and hence of living standards, but a consideration of ‘actual individual consumption’ (AIC) suggests that this is not so. AIC adds together consumer spending by households and current spending by government on behalf of households on things such as health and education. It is thus a measure of what is spent by or on behalf of households.
Professor Doyle says that AIC ‘is not a standard measure of living standards’. However, it is used by Fitzgerald and Morgenroth (2020) in their papers on the Northern Ireland economy. Even Bergin and McGuiness say that it is “a useful indicator of the level of goods and services that individuals enjoy”. Also Patrick Honohan states that AIC is ‘an alternative aggregate national indicator of household welfare used in international comparisons’. The conclusion to Dr. Honohan’s article is worth repeating in full:
“Ireland is a prosperous country, but not as prosperous as is often thought because of the inappropriate use of misleading, albeit conventional statistics. There is less consumption per capita than in the UK, and on this metric we are closer to New Zealand, Israel and Italy, than to the United States, Switzerland or Norway (which is where the GDP comparison would put Ireland). The same conclusion is drawn if GDP is replaced with the Ireland-specific GNI* indicator (my emphasis). Using GDP as a measure can mislead analysis of such matters as debt, carbon-intensity and inequality:
While GDP or GNI must be regarded as discredited measures of living standards, there is little reason to suggest that AIC is not an eminently sensible measure. After all, it measures what is spent by and on behalf of households. In the case of the Republic of Ireland it is doubly appropriate since both household consumption and government spending do not include any distorting effects from multinational company profits. This measure suggests that living standards in the Republic are 6-8% below those in the UK when price differences are taken into account (see table above).
Anyone who uses any GDP measure is thus using statistics which are not creditable measures of relative standards. Do Bergin and McGuiness use GDP measures? Well yes, they do. In their first paper on this, published in the Cambridge Journal of Economics they mention two measures of living standards. The first is per capita GDP where they conclude that Northern Ireland has living standards 50% lower than in Ireland’s Southern and Eastern region (which contains three-quarters of Ireland’s population) but slightly above the rest of Ireland in the poorer Border, Midland and Western region. The other measure was household disposable income, which they found to be $3000 a year higher in Ireland than in Northern Ireland. This measure was criticised in my own QUB article for not taking into account the fact that consumer and housing prices were lower in NI compared to the national UK price index which they used.
In their second article Bergin and McGuinness mention the flaws in the per capita GDP measure but still use it, and GNI, in their table 1. On page 147 (footnote 8) they say that per capita GDP in the Republic is 232% higher than in Northern Ireland[i]! They also say in this article they prefer GNI* which they regard as having removed the FDI-related distortions. They say that per capita GNI* in the Republic is 51% higher than per capita GDP in Northern Ireland, but they wrongly compared current price GNI* in the Republic with constant price GDP for Northern Ireland. The correct figure for this comparison would be 41%. We might notice that none of these points were picked up by those who reviewed the article for the journal, just as the inappropriateness of using Irish GDP figures was apparently not picked up by the CJE reviewers.
As Patrick Honohan suggests, although GNI* removes the most obvious distortions it does not seem to remove them all. Elsewhere in the paper Bergin & McGuinness discuss north-south differences in trade without apparently recognising that exports in Ireland are equivalent to 122% of GDP and imports are 94% of GDP. In other words, Ireland exports more than its total output of goods and services. In the UK, an economy without the Irish distortions, exports and imports are a more normal 30% of GDP. The distortions in Ireland’s account clearly stretch well beyond the profits of multinational companies.
Bergin and McGuinness reject the AIC measure in favour of household disposable income on the grounds that consumption is affected by savings. In other words, for any given income a household will spend less if it saves more. This is true in principle, but current living standards depend on spending not on saving. Most saving takes the form of pension contributions and capital repayments on mortgages. In areas of high house prices, including Dublin and London but not Belfast, mortgages are necessarily larger and capital repayments greater. This means that there is less to spend on current consumption. The upside of course is that households own more valuable housing assets, although the value may accrue to their descendants rather than to themselves.
Bergin and McGuiness calculate that household disposable incomes were 12% higher in the Republic in 2017 than in Northern Ireland. This is based on consumer price differences at national level. However, prices are lower in Northern Ireland than the UK average and hence money buys more goods and services. The ONS calculated regional consumer prices excluding housing for 2016 and it is assumed here that the ratio of Northern Ireland prices to UK prices remains the same in 2018. The ONS calculation is that consumer prices in Northern Ireland are 2.4% below the UK average. Housing costs are 30% lower and combining the two (with a 20% weight for housing) gives aggregate prices in Northern Ireland at 8.1% lower than the UK average. Allowing for this price difference gives household disposable income in Northern Ireland in 2018 at 2.8% below that in the Republic. Using the same price adjustments for Northern Ireland, my calculation is that in 2018 NI had higher consumer spending than the Republic by 1%. The difference between the income and expenditure figures is due to differences in saving.
These calculations do not include spending by government on behalf of households on health, education etc. Government current spending per head at national PPP prices in Northern Ireland was 18% above that in the Republic in 2018. No allowance is made here for lower NI prices since most wages in the NI public sector are at national UK levels. Combining consumer spending with government current spending results in Northern Ireland having actual individual consumption 5% higher than in the Republic[ii].
The standard of public services in Northern Ireland does not always fully reflect the higher spending and NI’s advantage may not be as large as 5%. Bergin and McGuinness discuss aspects of service provision including in health where the NI Assembly has long failed to drive up standards to national UK levels in face of foot-dragging from the medical profession. In education Bergin and McGuinness’s analysis is less secure, being based largely on inputs and not outputs including international PISA scores. The 2018 PISA scores show NI above the OECD average for all three subjects. For science and maths there is no significant difference between NI and the Republic although the latter was as always clearly better at literacy.
There is no time here to support my claim that ‘the view of the NI economy from southern economists has always been jaundiced and self-serving’, which Professor Doyle describes as unsubstantiated. Two examples may however give a flavour. Bergin and McGuinness (2020) say that “In Northern Ireland employment in manufacturing fell over the 1970s… this performance was much worse than the wider UK” (p783). This is partly true, but employment in manufacturing fell fairly consistently throughout the UK from 1970 right through to 2010 as the UK became a service-oriented economy. Northern Ireland did a little worse than the UK average in the 1970s but much better in the 1980s. Manufacturing employment in NI then actually expanded in the 1990s up to the Good Friday Agreement in 1998 while it fell in GB. After the GFA, decline set in again, but more slowly than in GB. Over the whole period of the Troubles, 1970-98, manufacturing employment declined significantly less in NI (34%) than in GB (44%). This can be put down to a lower cost base and government financial support especially for new FDI. None of this good story is mentioned by Bergin and McGuinness (2020). Only the 1970s are referenced, using as evidence a 40-year-old article[iii]. As in other studies, an arbitrary time-period is selected which shows NI in a negative light and favourable performance is overlooked.
The second example is the statement in Bergin and McGuinness (2020) that “the nationalist, mainly catholic, population were geographically concentrated into poorer areas and suffered from economic and social discrimination”. The only evidence cited is the same 40-year-old article[iv]. No later work is cited including those which show that Catholics were actually over-represented in state-owned housing and not under-represented as generally believed or argue that high catholic unemployment had structural causes.[v]. This level of superficial comment should not be acceptable in academic journals. Neither this, nor the example in the previous paragraph, appear to have been questioned by the referees for the CJE.
All of this is of course relevant to the issue of a border poll on Irish unity. Some pointed out that voters rarely vote to become poorer. This is not quite right in national questions where sovereignty or national identity are at stake, but nevertheless living standards will always be of some relevance. The fact that the Republic of Ireland has not managed to overtake living standards in one of the UK’s poorest regions, even after 60 years as a tax haven is likely to be at least one reason why half of Northern Ireland’s Catholics regularly tell the Life and Times survey they would prefer to remain in the UK rather than join a united Ireland.
Footnotes
[i] This appears not to use the correct value for GDP in Northern Ireland.
[ii] In my original article on this site, I commented on the two estimates of Fitzgerald and Morgenroth for relative living standards.. These were that NI had higher living standards (measured as AIC) of 20% in 2021 and 4% in 2016. There is no explanation for why these two figures are so different. Perplexingly, the figures in Table 11 of their 2019 paper suggest living standards in the RoI 20% below NI in 2012, but their table 12 says 14% below for the same year. Their NI data is stated as coming from NISRA, but no more precise source is given. It was clear that the comparison was based on national estimates of purchasing power parity (from Eurostat) and that local price differences had not been taken into account. Using the ONS 2016 price deflator plus house prices, giving prices in NI at 8.1% lower than the UK average, would increase the advantage of NI living standards over those in Ireland. In my original article I took an average of the two F&M figures, deflated for NI prices to get a value of 20% for the difference in living standards. In this article a more careful estimate using different data from F&M gives a value for AIC living standards in NI at 5% above Ireland.
[iii] Rowthorn R, (1981) Northern Ireland. An economy in crisis. Cambridge Journal of Economics vol 5 no 1.
[iv] Rowthorn R, (1981) Op cit
[v] See Gudgin G,(2020) Discrimination in housing and employment in Barton and Roche (2020) The Northern Ireland Question. Perspectives on Nationalism and Unionism, Wordzworth or the earlier version in Barton and Roche (2019) The Northern Ireland Question, Nationalism, Unionism and Partition. Routledge Revivals. Gudgin (1999) The Northern Ireland Labour Market in Heath, Breen and Whelan (1999) Ireland North and South. Perspectives from Social Science. OUP
The views and opinions expressed in this article are those of the author and do not necessarily reflect the views, official policy or position of Queen’s University Belfast.
The featured image has been used courtesy of a Creative Commons license.