
Northern Ireland’s electorate voted to remain in the EU with a considerable margin in the recent referendum: 55.8% versus 44.2%. But while the headline result was remain, there was considerable variation across the region: seven out of Northern Ireland’s 18 constituencies voted to leave. The polity was also the region with the lowest turnout: 62.7% – the next lowest being the UK’s other remainer, Scotland, with a 67.2% turnout.
Why did voters vote the way they did? The key conclusions of post-referendum analysis of voting behaviour across the UK relate to age, where younger voters were far more likely to vote remain, and education, where areas with the highest graduates were most pro-EU.
The Guardian has mapped a number of interesting geographic voting trends while here on QPol, Alan Fernihough has looked at how demographics and education combine to explain the result in Great Britain. Meanwhile, the analysis for Northern Ireland has focused exclusively on the apparent nationalist/unionist split.
We have studied the characteristics of each of Northern Ireland’s 18 constituencies in order to draw some tentative conclusions about the typical profile of EU supporters – and how this differs from the rest of the UK. We fail to find a single factor that predicts the remain vote share better than the nationalist vote share, and our evidence suggests that education was not as important as it was in Great Britain. However, caution is required when interpreting such geographic data; if there are more degree-holders in remain-voting areas, does it mean it was the graduates who voted to remain?
Figure 1: Nationalist constituencies tended to vote strongly for remain (left), but tended to have a lower turnout (right).
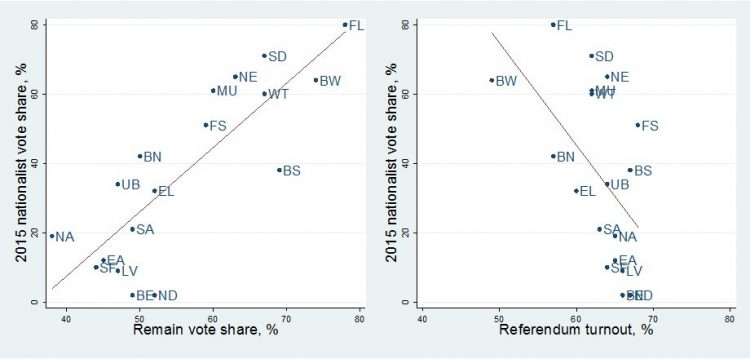 Constituencies: BE=Belfast East; BN=Belfast North; BS=Belfast South; BW=Belfast West; EA=East Antrim; EL=East Londonderry; FS=Fermanagh and South Tyrone; FL=Foyle; LV=Lagan Valley; MU=Mid Ulster; NE=Newry and Armagh; NA=North Antrim; ND=North Down; SA=South Antrim; SD=South Down; SF=Strangford; UB=Upper Bann; WT=West Tyrone.
The strength of the remain vote in nationalist areas is clear to see. Foyle, Northern Ireland’s most nationalist constituency, produced the strongest remain vote, and the 4th-strongest of any area in the UK. But the line-of-best-fit in Figure 1 implies there was also significant remain support amongst unionists; in constituencies with very small nationalist vote shares, there was still a 40-to-50% remain vote. This is not necessarily surprising: the Ulster Unionists, the polity’s second-largest unionist party, campaigned for the remain side.
Figure 2: Agricultural employment is a poor estimator of the remain vote (left), while population density does a better job for non-urban constituencies (right).
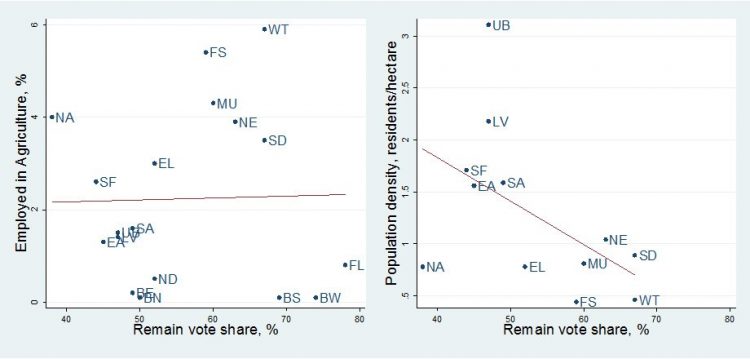 Source: 2011 Census, House of Commons Library (agricultural employment), NINIS/NISRA (population density).
Unsatisfied with such a simplistic nationalist/unionist explanation, we consider a number of other factors which might have influenced people’s vote. We report on only a few of these here.
Given the importance of agriculture to Northern Ireland’s economy, as well as the prominence of the EU’s Common Agricultural Policy in the debate here, we explore how farming might have influenced the result (see figure 2). Data show that even in Northern Ireland’s most rural constituencies, less than 6% of the population is employed in agriculture; and so share of agriculture proves to be a poor estimator of how a constituency voted.
We next use a broader measure of “ruralness”, to determine if a general “connection to the land” encouraged a remain vote. Excluding the urban constituencies in Belfast, Foyle and North Down, we find that more scarcely populated areas voted more strongly in favour of remain. This measure is, however, difficult to disentangle from the unionist/nationalist result; the area’s most rural areas are the predominantly nationalist south-western constituencies.
Figure 3: Younger constituencies were more likely to vote remain (left), but higher education had little impact (right).
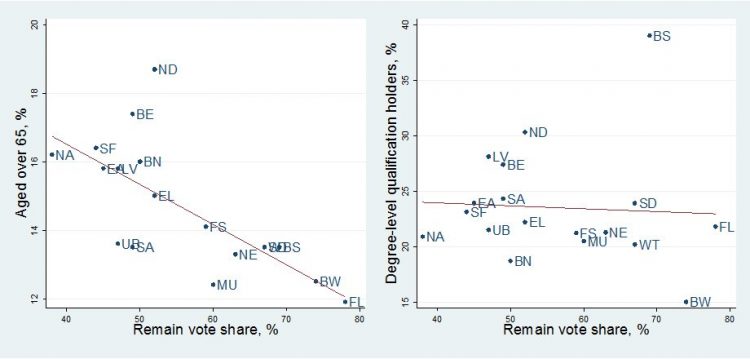 Source: 2011 Census, House of Commons Library.
We look at demographics and education to see how Northern Ireland compares to the rest of the UK. Our constituency evidence supports the result that older voters were more likely to vote leave. The extent of this relationship appears equally strong for both unionist and nationalist constituencies, but again it cannot explain the whole picture – no more than 20% of the population is aged over 65 in any of Northern Ireland’s voter districts.
Meanwhile, education appears to be a far less effective predictor of EU support than in Great Britain. There is next to no correlation between the proportion of a constituency holding a degree and a remain vote – hence the flat line-of-best-fit in figure 3. Belfast South, Northern Ireland’s most educated constituency and the home of Queen’s University Belfast, sided strongly for the remain camp – but so did Belfast West, the constituency with the fewest graduates.
There are a number of possible explanations as to why the UK-wide education pattern is not found in Northern Ireland. Firstly, graduates appear to be broadly dispersed between rural and urban areas in Northern Ireland, whereas in England they are concentrated in the biggest cities. Secondly, there are fewer graduates in Northern Ireland than in the rest of the UK, so it is no surprise that education affects the outcome less. Finally, it is important to recognise that the absence of a correlation amongst constituencies does not necessarily indicate that graduates did not vote remain. Such an “ecological fallacy” emerges when assumptions are made about individuals based on data about the group to which they belong – in this case, their constituency.
We end with a plea to political scientists: in order to get to the bottom of Northern Ireland’s unique voting behaviour, we need good individual-level data on the choices and attributes of its voters. Please commission a post-election survey of voters!
Contributors’ Profiles

Edward Mills graduated with a First Class Honours BSc Economics from Queen’s University Belfast in July 2015, winning a prize for the best undergraduate economics dissertation in his cohort. He is currently completing an MSc Economics at Queen’s, and will start as a Research Officer at NERA Economic Consulting in London in September 2016.

Dr Chris Colvin is a Lecturer in Economics at Queen’s Management School, Queen’s University Belfast, where he is also the Director of Postgraduate Research. He teaches managerial economics to second-year students, and economic history to third-year students.
The featured image in this article has been used thanks to a Creative Commons licence